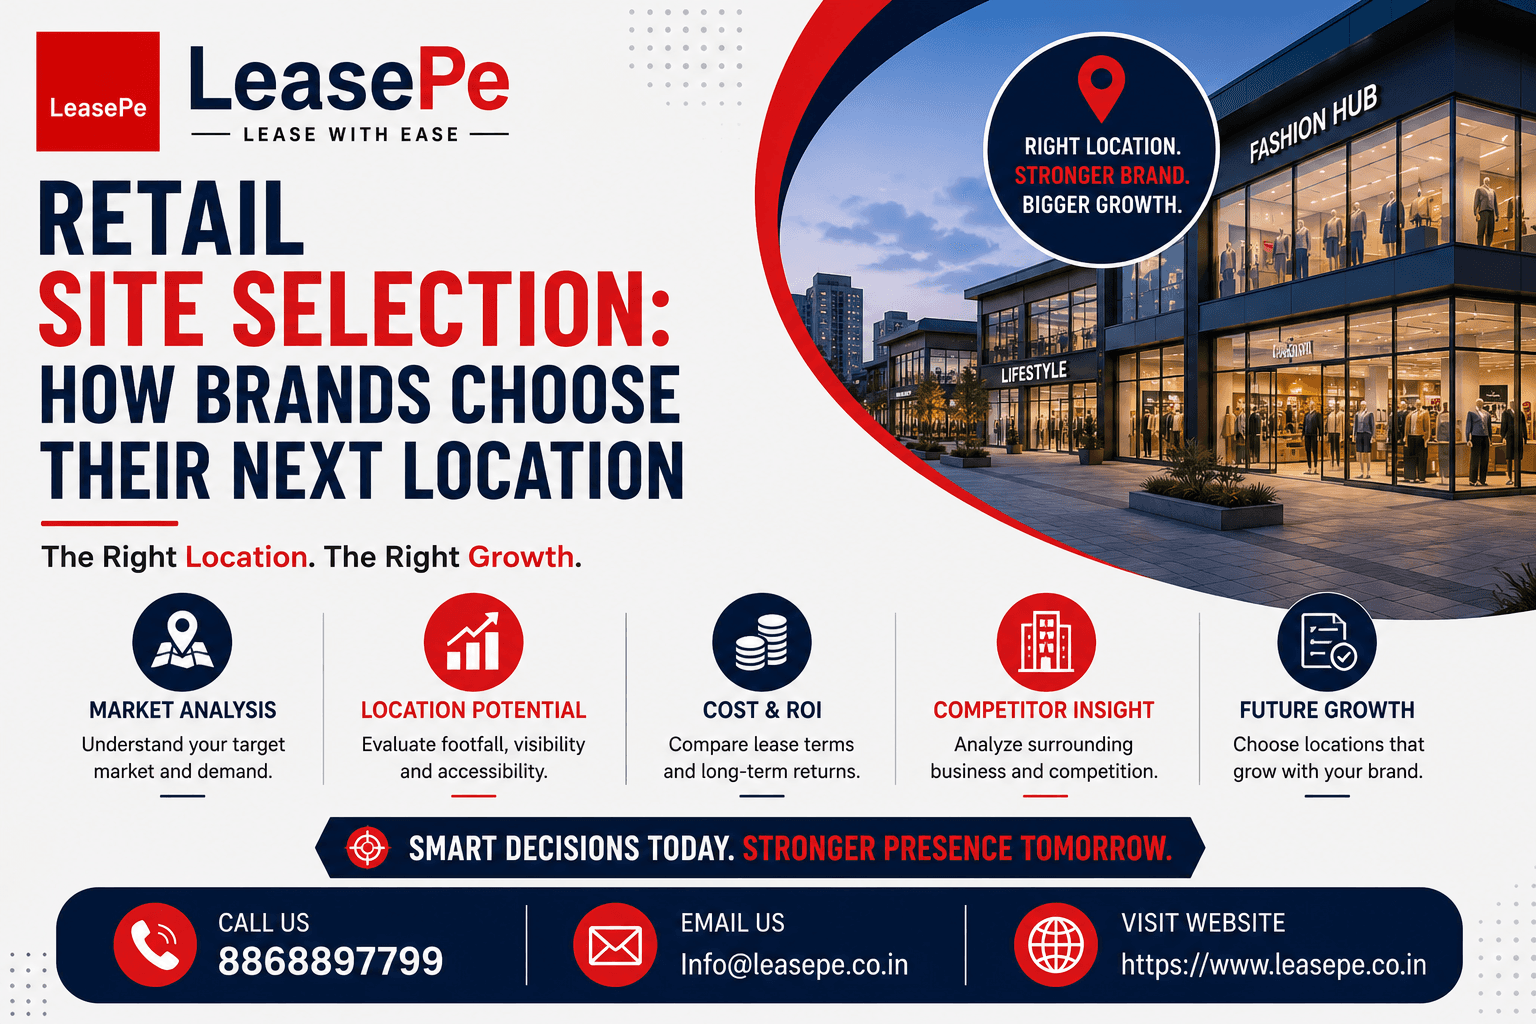
Retail Site Selection Guide: How Brands Choose Locations in India
Discover how top retail brands select showroom locations. Learn the demographic data, micro-market metrics, and GIS mapping secrets that drive retail site selection.
Retail Site Selection: How Brands Choose Their Next Location
For any retail business, location is not just a line in an expense ledger—it is the single most critical factor determining success or failure. While a digital e-commerce storefront can be redesigned overnight, a physical retail store is bound by its lease. Signing a lease in the wrong location is an incredibly expensive mistake that is very difficult to reverse.
When premium national brands, retail chains, and food and beverage giants look for their next commercial space on lease, they do not rely on gut feeling or simple roadside footfall estimates. Instead, they use a highly sophisticated, data-driven methodology called retail site selection.
By analyzing precise demographic data, micro-market metrics, and spatial patterns, brands can accurately predict a location’s future revenue before signing a commercial lease agreement. Here is an inside look at how modern brands select their next retail location in India, and how landlords can prepare their properties to match these demands.
1. Defining the Store Catchment Area Before looking at specific properties, brands map out the location's catchment area—the geographic zone from which a store draws its customers. This catchment zone is typically divided into three distinct tiers
Primary Catchment (60-70% of sales): Customers living or working within a 5 to 10-minute walk or drive.
Secondary Catchment (15-20% of sales): Customers within a 10 to 20-minute driving radius.
Fringe Catchment (Remaining sales): Occasional visitors, commuters, or destination shoppers traveling from further away
Brands map these zones using geographic information systems (GIS) to analyze actual drive times and travel patterns rather than simple linear distance on a map.
2. Core Demographic Data Metrics Once the catchment boundary is drawn, brands analyze the local population's profile to ensure it aligns with their target audience. They focus on three primary demographic datasets:
Population Density & Daytime vs. Nighttime Population A high-density residential area is perfect for supermarkets and grocery stores. However, a premium lunch cafe or high-end office wear retailer needs a strong daytime population—meaning a high concentration of working professionals who occupy nearby office buildings during business hours.
Purchasing Power Parity (PPP) & Disposable Income Brands look at local income levels, average property prices in the area, and vehicle ownership rates to estimate the neighborhood's spending power. A luxury fashion label and a discount retail store look at the exact same location through completely different financial lenses.
Keep reading
Related insights

real estate
Commercial Property Climate Resilience: What Businesses Should Know | LeasePe
Discover how heat, flooding, power reliability and building resilience can affect commercial property leasing in India. Learn what businesses should evaluate before choosing a space.
real estate
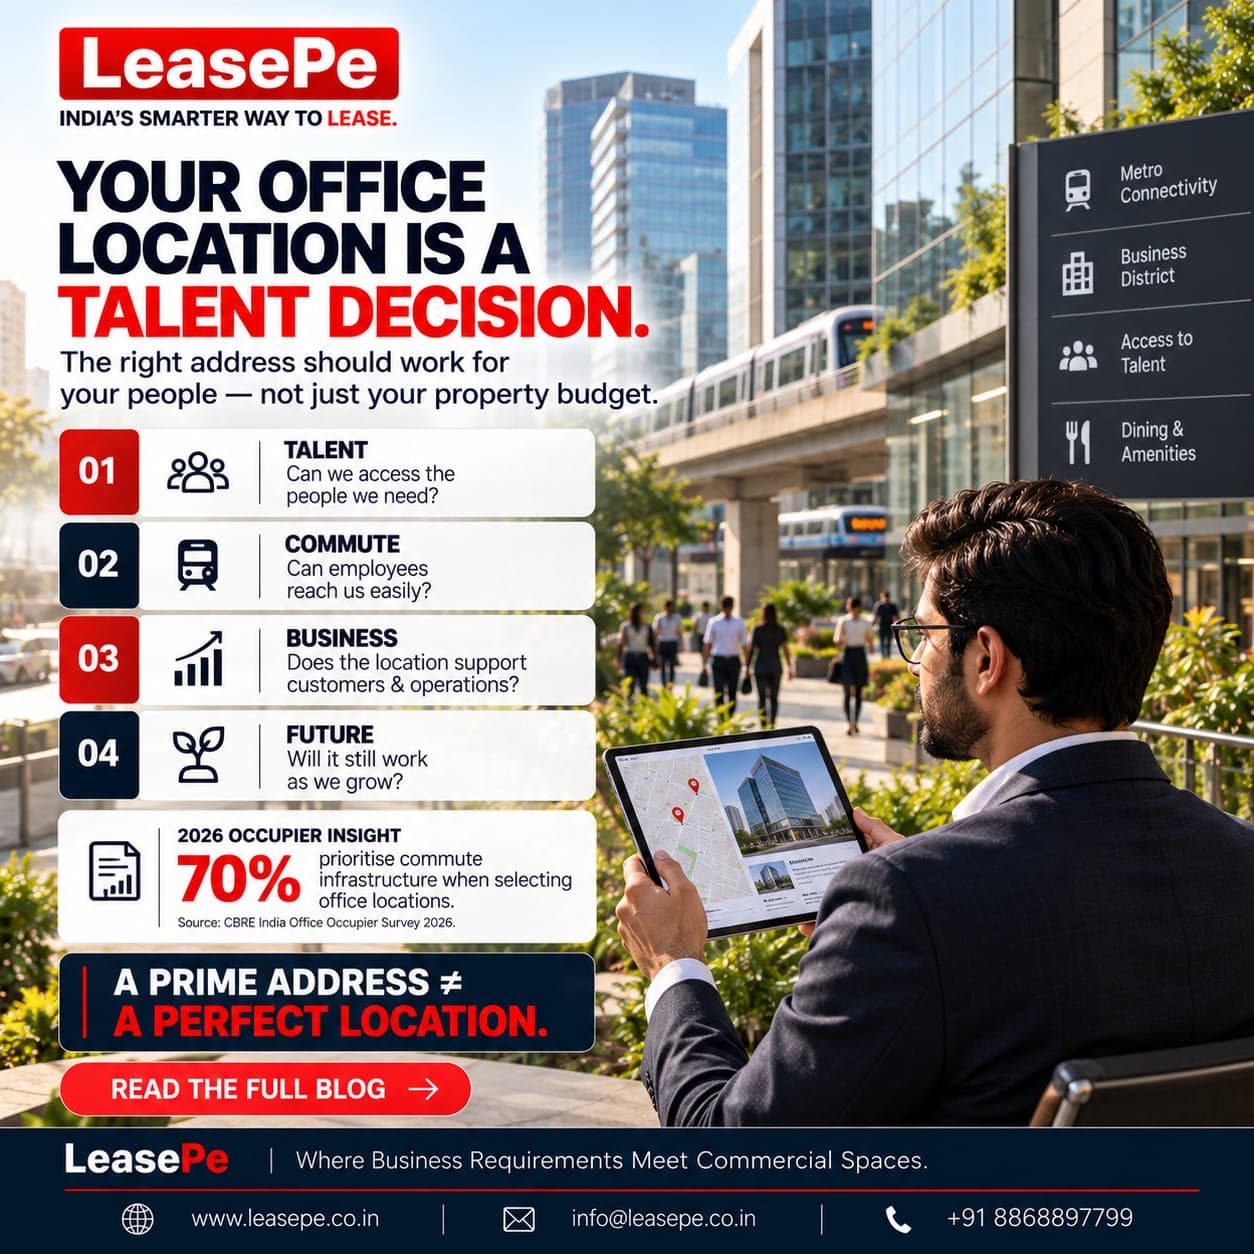
Office Location Strategy: Why Your Commercial Location Is a Talent Decision | LeasePe
Your office location affects more than rent. Learn how commute, talent access, workplace experience and location psychology influence commercial leasing decisions in India.